Expert insights on the new Power BI
8 April 2022 | Noor Khan


As part of the Microsoft Power Platform, Power BI was released as data visualisation and reporting tool, primarily focusing on business intelligence. The software can be used individually or as part of the group of platforms offered by Microsoft including Power Apps and Power Automate. It has been around since 2015, however, has gone through a number of changes. In this article, we will look at the new Power BI in its current form.
What is Power BI
Data is being produced at exponential rates every day. Businesses now more than ever rely on that data therefore; they need to be able to make sense of the data to make well-informed business decisions. Power BI is a data visualisation tool that enables businesses to understand, analyse and report on data. It has become of the leading business reporting tools in a short span of time to rival some of the biggest data reporting technologies such as Tableau. According to Slintel, Power BI has a market share of 12.86% compared to Tableau's market share of 15.77%, taking into consideration the much shorter time it has been around, we can expect the technology to dominate the market in the near future.
Our engineers have worked on a number of data engineering projects leveraging the Power Platform technologies to deliver powerful data reporting and analysis platforms.
Benefits of the new Power BI
Microsoft Power BI is continuously evolving and as it stands today the software is much more powerful and robust and offers granular level customisation. It offers a number of unmatched benefits which is why it has gone from strength to strength in the market and include.
- Easy to use – It is considered easy to use as compared to its counterparts. It is suitable for a variety of users and does not require advanced data analysis or technical skills.
- Cost-effective – Offers a free version for personal use. Additionally, it’s a lot more cost-effective than Tableau in terms of pricing.
- Data source integration – You can access data from multiple data sources including Excel, SV, PDF, JSON, XML, databases, apps and more.
- Real-time analytics – Enables you to connect with data sources such as social media to get real-time analytics.
- Visual capabilities – One of the key selling points of any data reporting and visualisation tool is the stunning visual capabilities and Power BI does not disappoint. With easy to digest and visually impressive capabilities, it presents data so it can be understood through graphs, charts and more.
- Machine learning – Built-in machine learning features can help users spot trends and make educated, informed predictions.
- Large volumes of data – It is a powerful software tool that can handle huge volumes of business data.
- Highly customisable – Users can customise their dashboards, interfaces, reports to access reports they need quickly and easily, saving time and increasing productivity.
- Microsoft backing – It’s a relatively new technology, however, it has already secured a good portion of the business intelligence market share. With a powerful brand backing the technology, we can predict it will continuously evolve and improve with investment
Limitations of the new Power BI
There are some limitations you need to consider if you are looking at Power BI and they include:
- Messy UI (user interface) - Some consider the user interface crowded and messy rather than a clean look with fewer icons.
- Dealing with large volumes of data – You will be required to take out the premium package if you are dealing with large volumes of data.
- Slow data processing - Some have found that processing large volumes of data is slower than usual.
- Table relationships – It can fully understand simplistic relationships between tables, however, anything complex will require the creation of unique fields to avoid confusion.
Industry experts and what they think
Microsoft Power BI has been regarded highly by the likes of Gartner and Forrester. Gartner has recognised Microsoft as a leader in Analytics and Business Intelligence Platforms for fourteen consecutive years. Forrester has also recognised Microsoft as a leader for Augmented BI Platforms for Q3 of 2021.
“It is hard not to consider Power BI as your top choice for an enterprise BI platform.” – Forrester Q3, 2021 Report
Laxman Amrale, Data Engineering Expert at Ardent commented: “Microsoft first introduced the technology in 2014 and released the tool to the general public in 2015. Initially, it didn’t provide all of the capabilities for customised solutions and lacked the ability to peel away different layers. For example, you couldn’t leverage the data ingest portions of Power BI with custom visualisations, forcing exclusively the use of Power BI’s visualisation technology with no ability to customise it to client needs.
Now Power BI can be leveraged for all data ingest and can create custom data visualisations to render the information. We have complete control of the user experience with Power BI handling all of the data intakes. Charts can be directly taken from Power BI and integrated into our custom solutions.
With Power BI, clients do not require developers to add charts for them, they can use the tools to create the charts independently. Over time, Power BI data visualization has become much more powerful, robust, and customizable to specific needs.”
Explore our data engineering services.
Recent updates to Power BI
There have been some stand out updates that have evolved and improved the platform significantly and they include:
- Performance improvements to backup and restore operations for datasets in Power BI. Benchmark tests with 1GB, 5GB, and 10GB datasets show backups can now be completed up to 22 times faster than before, and the time required for restore operations can also be reduced by more than 30%.
- Public preview of new mobile formatting options. Now you can choose to have two separate designs for the same visual, one for each layout.
- General availability of Export Power BI report to file API. This API allows you to export Power BI reports to the following file formats: PDF, PowerPoint and PNG, by using a REST call.
- New admin APIs to retrieve email subscriptions and widely shared reports.
- Asynchronous refresh is now available for public preview. The asynchronous refresh REST API for Power BI brings built-in features for reliability, such as auto retries and batched commits.
Ardent Power Platform services
Power BI is a technology that has continuously evolved and improved over time. With a number of benefits it offers as a rival of Tableau and other business intelligence and data reporting technologies, it stands firm in the market. Our data engineers have worked with Microsoft Power Platform tools including Power Apps and Power Automate to deliver fully integrated, automated business intelligence solutions to several clients. If you are looking to utilise these powerful tools for your next project and are looking for credible, experienced data engineering experts, then get in touch to find out how we can help.
Ardent Insights
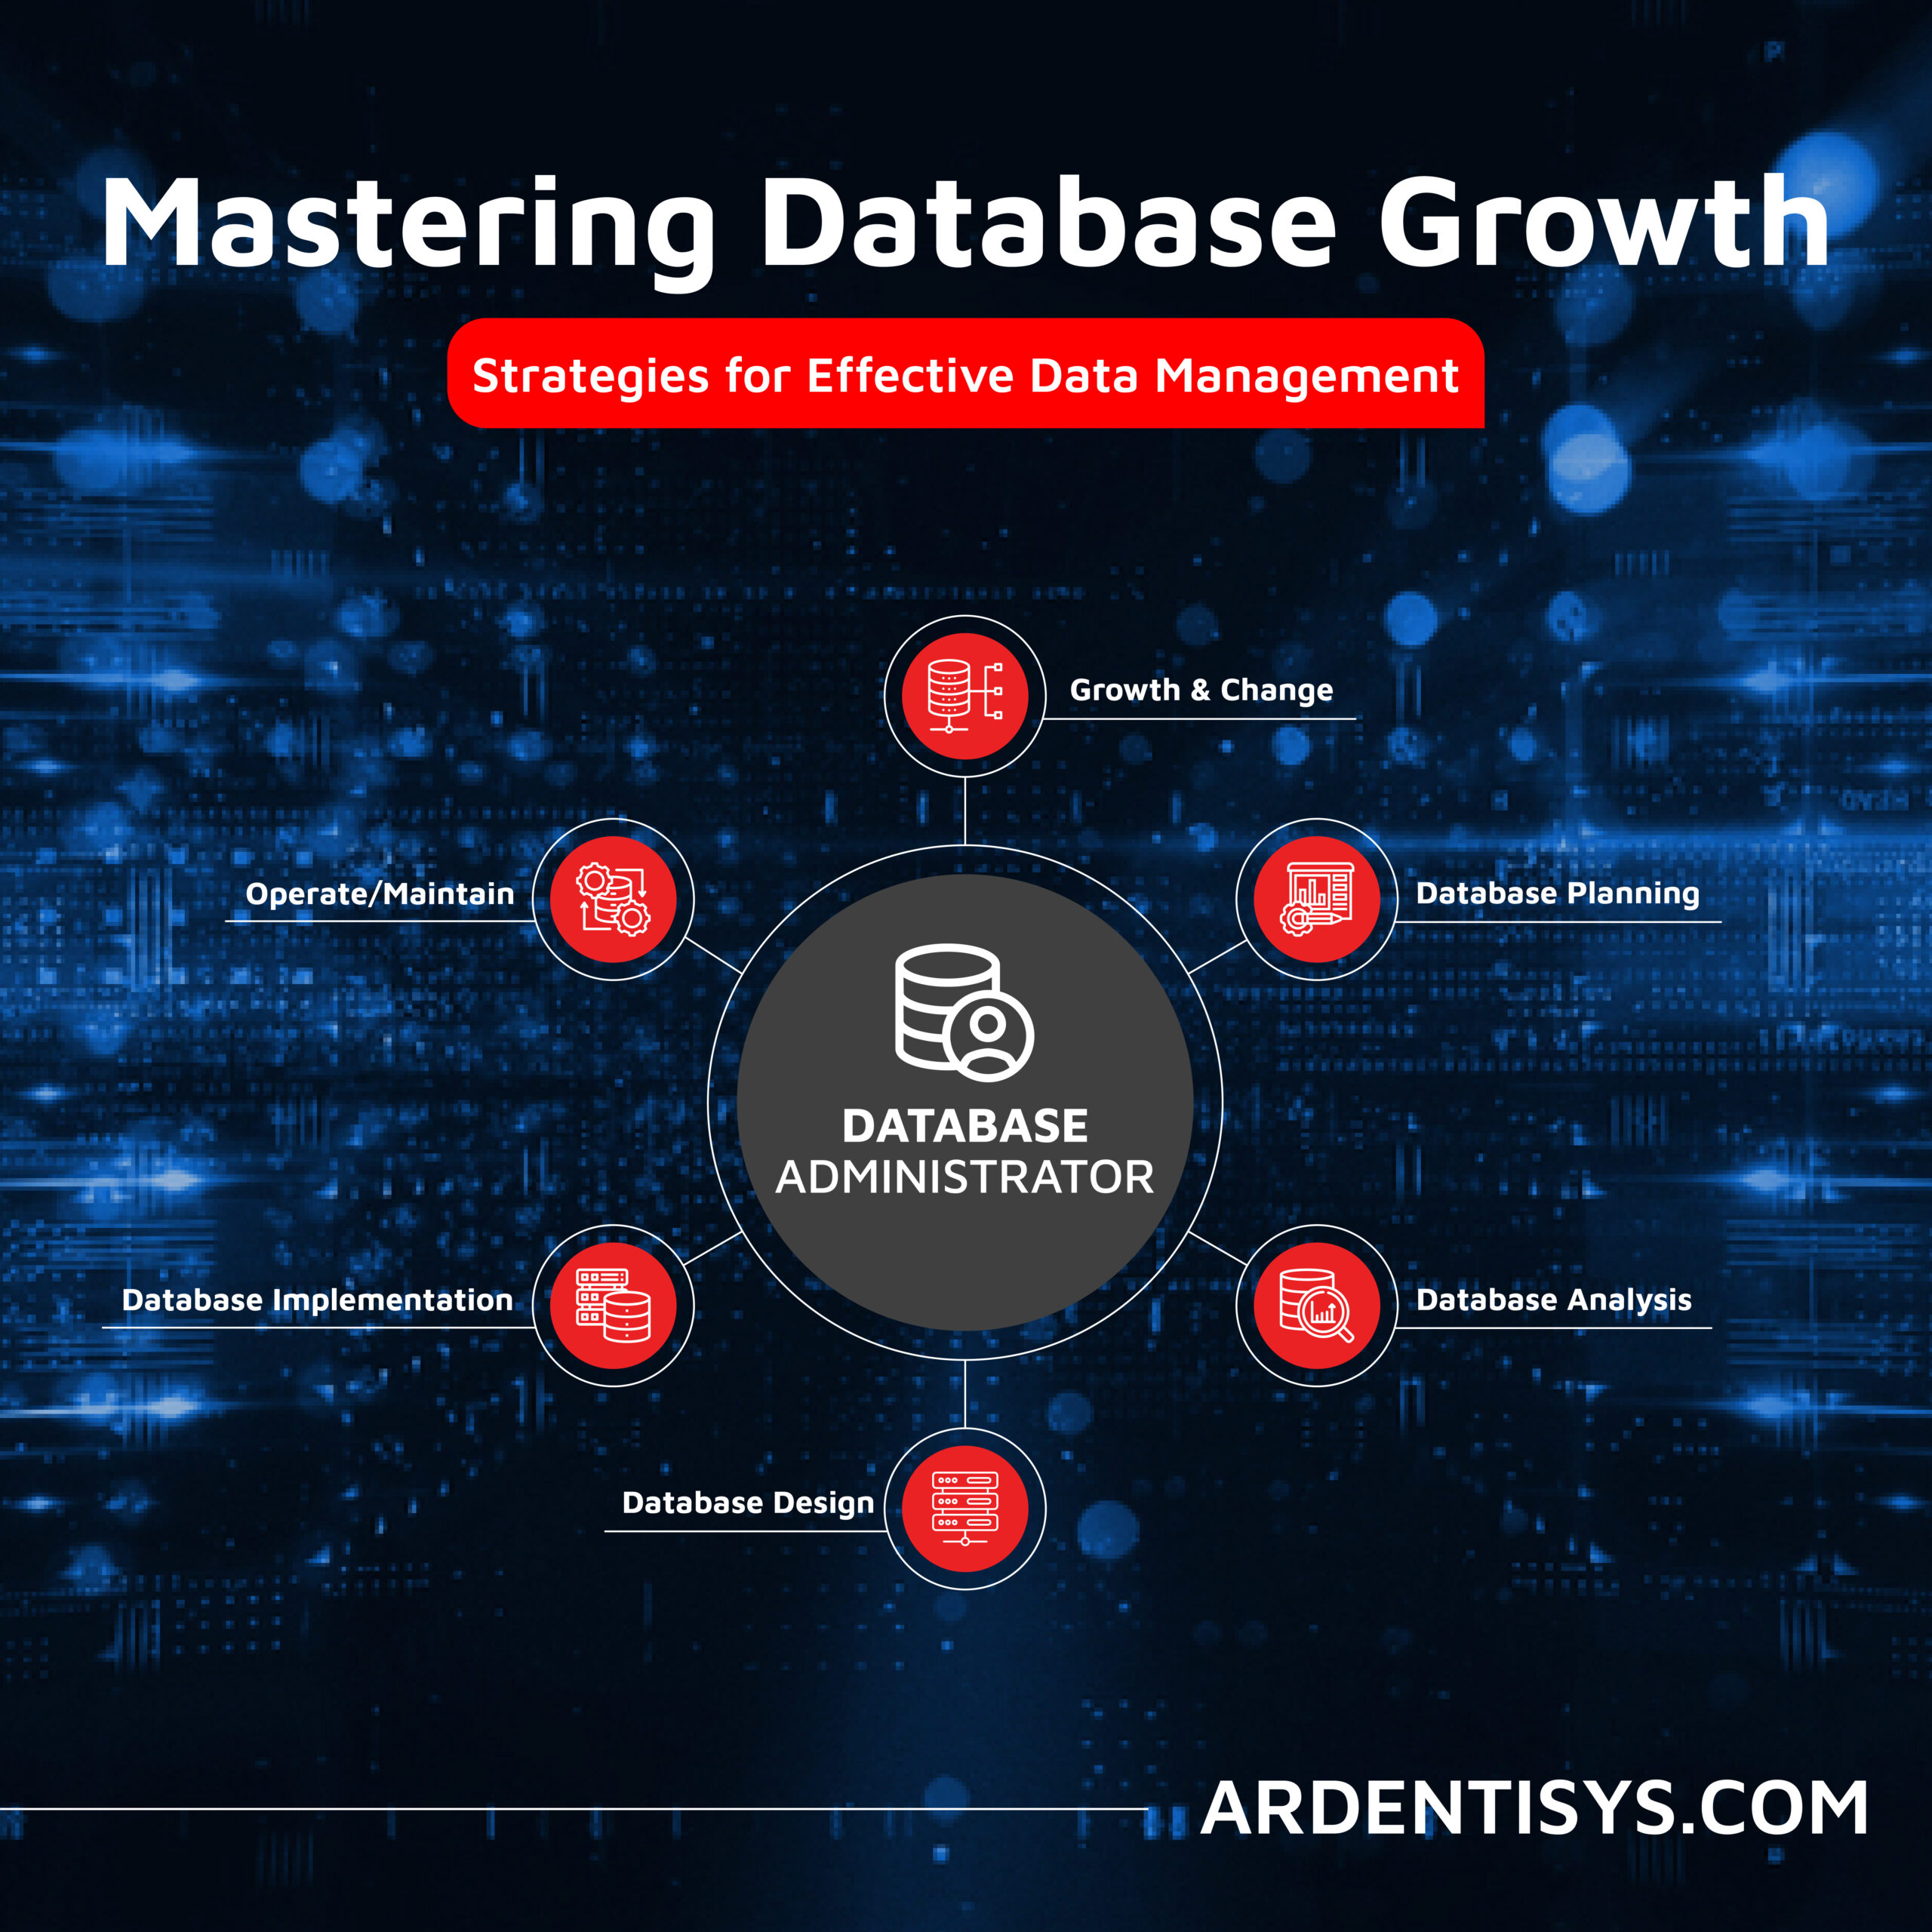
Overcoming Data Administration Challenges and Strategies for Effective Data Management
Businesses face significant challenges to continuously manage and optimise their databases, extract valuable information from them, and then to share and report the insights gained from ongoing analysis of the data. As data continues to grow exponentially, they must address key issues to unlock the full potential of their data asset across the whole business. [...]

Are you considering AI adoption? We summarise our learnings, do’s and don’ts from our engagements with leading clients.
How Ardent can help you prepare your data for AI success Data is at the core of any business striving to adopt AI. It has become the lifeblood of enterprises, powering insights and innovations that drive better decision making and competitive advantages. As the amount of data generated proliferates across many sectors, the allure of [...]
Why the Market Research sector is taking note of Databricks Data Lakehouse.
Overcoming Market Research Challenges For Market Research agencies, Organisations and Brands exploring insights across markets and customers, the traditional research model of bidding for a blend of large-scale qualitative and quantitative data collection processes is losing appeal to a more value-driven, granular, real-time targeted approach to understanding consumer behaviour, more regular insights engagement and more [...]

Services
About
UK
US
India

